WordPress LCP Recovery: 5.5s → 2.49s on a 25-Year-Old News Platform (Into Google’s “Good” Zone)
By Maciej Nowak
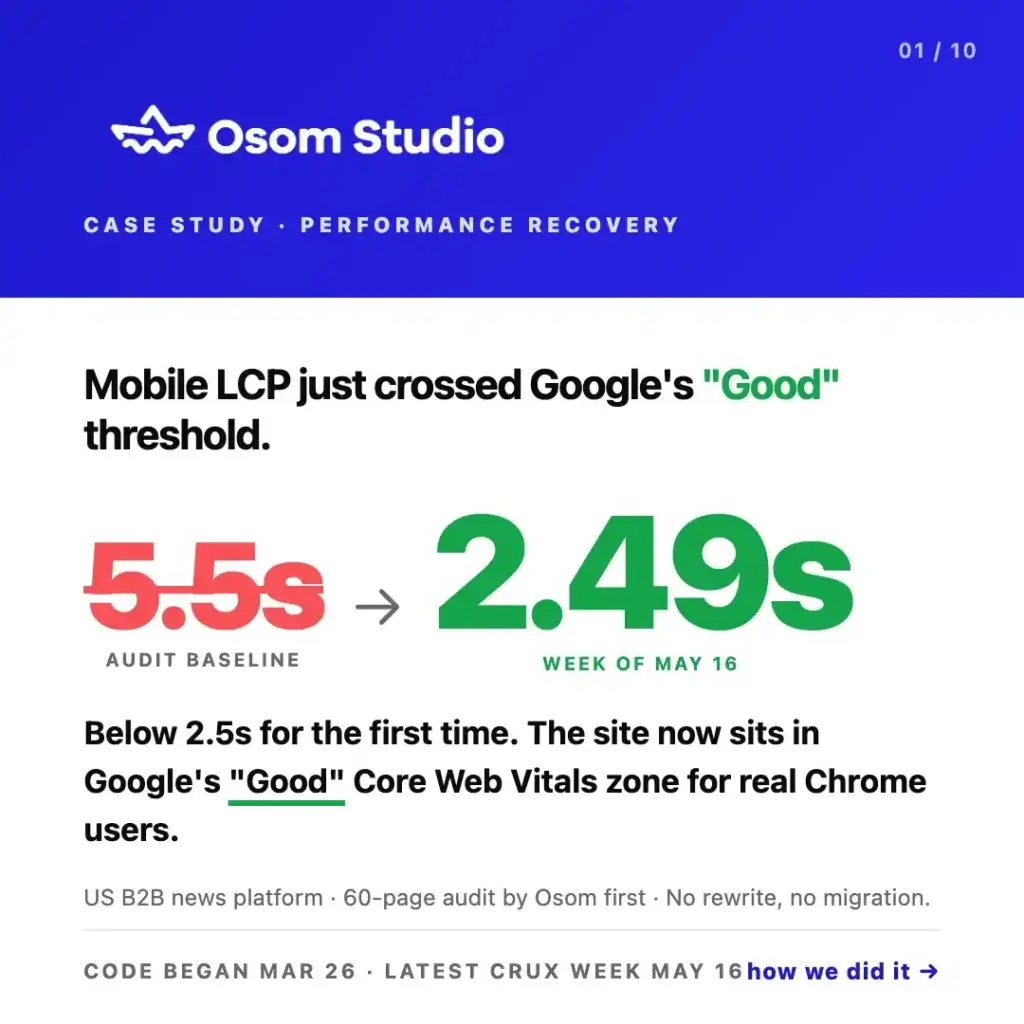
Case study: audit-first WordPress recovery took mobile LCP from 5.5s to 2.49s — into Google’s “Good” zone. 15× more readers fast, 40%+ traffic, no rewrite.
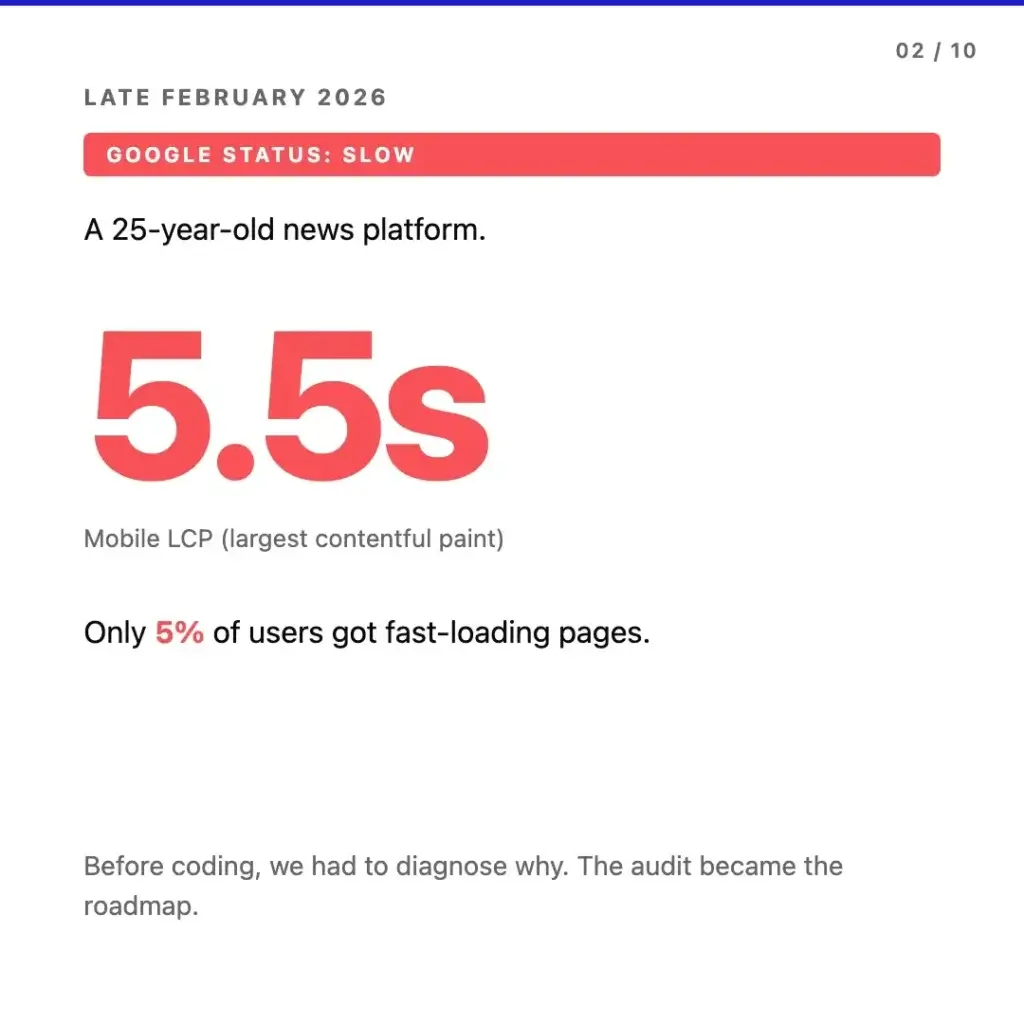
A 25-year-old US B2B news platform came to us in late February 2026 with Google Search Console flagging the site as slow. Mobile largest contentful paint (LCP) on real Chrome users showed 5.5 seconds. Only 5% of readers were landing on fast-loading pages. The instinctive next step would have been a rewrite proposal.
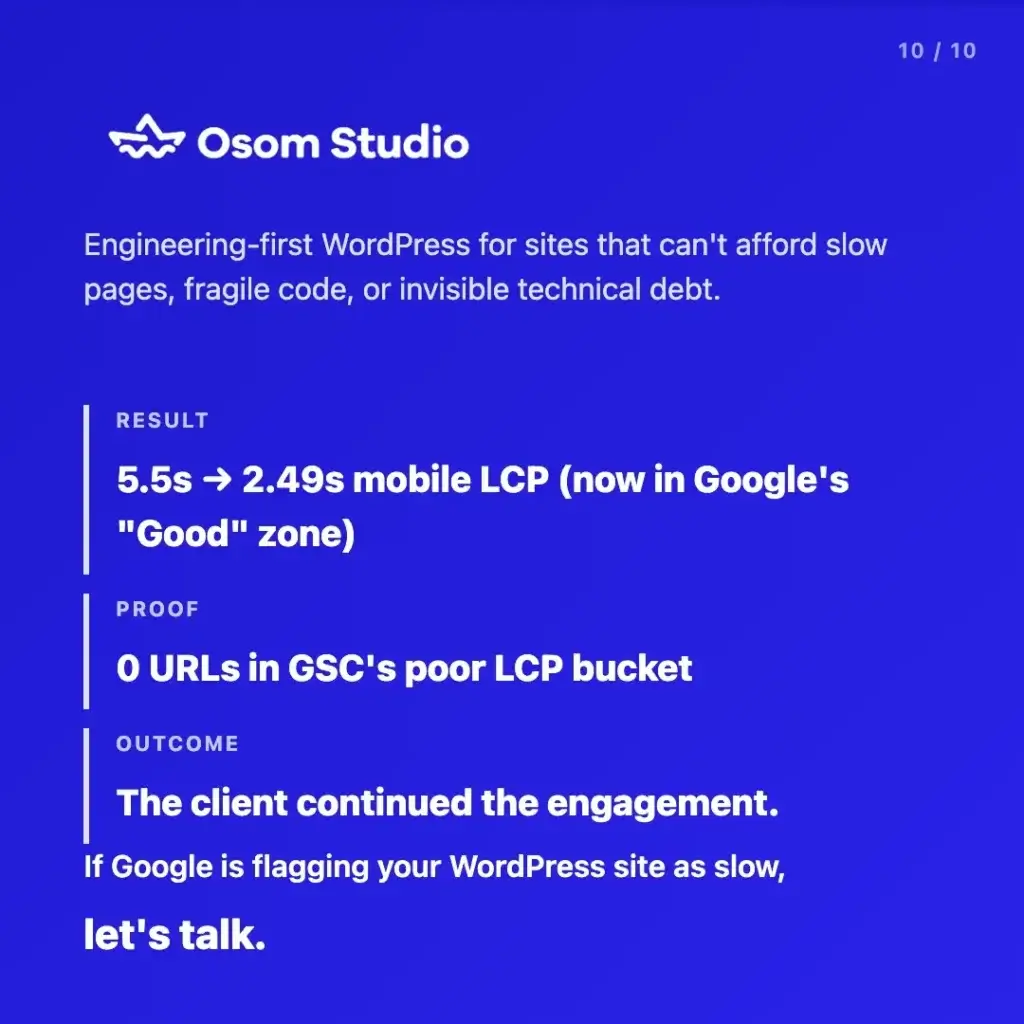
We ran a 60-page code audit instead. Eight weeks of engineering later, mobile LCP was down to 2.49 seconds — below Google’s 2.5-second “Good” threshold for the first time — 15× more readers were landing on fast pages, traffic climbed 40%+ across users, page views, and events, and Google Search Console showed zero URLs in its desktop “poor LCP” bucket. No rewrite, no migration, no CMS swap.
This is the case study.
The Situation: What Google Was Telling Them
The platform had been running on WordPress for over a decade, serving a US business readership across editorial content, podcasts, and gated reports. In late February the team noticed the familiar pattern – organic traffic plateauing, Page Experience signals turning yellow, ad partners flagging slow-load complaints from mobile users.
When we pulled the Search Console data, the picture was clear. Mobile LCP was averaging 5.5 seconds on real Chrome users, measured at the 75th percentile of field data. Only 5% of users were landing on pages Google considered fast. Lab tools were showing one picture; field data was showing a worse one. Google ranks on field data, and that was what mattered for the platform’s organic traffic.
Before any production code got touched, we needed to know what was actually wrong.
Why We Audited First Instead of Scoping a Rewrite
The default response when a long-lived WordPress site is “slow” is to scope a rewrite – migrate the content, build it on something newer, headless or JAMstack or whatever the current pitch is. For sites with significant SEO equity, an active editorial team, and a CMS investment built up over years, that path is often the highest-risk one unless an audit proves the existing platform cannot be recovered.
A rewrite risks SEO authority that took a decade to build. It disrupts editorial workflows the team has trained on. It triggers content migration risk – URLs to map, redirects to maintain, structured data to rebuild, an organic traffic exposure window across the cutover. And the assumption underneath the rewrite proposal – that the existing platform is the problem – is almost never verified up front.
The audit is what verifies it. Before quoting any kind of recovery work, you need to know which specific elements are slow, why they are slow, and what the smallest set of changes would be to fix them. For this site, that meant a WordPress code audit of the full stack – security, performance, hygiene, and frontend – produced before any production code was touched.
If you want the long version of how that decision works, we have a separate guide on what a WordPress technical audit covers and when rebuilding actually makes sense. The short version is: most slow WordPress sites we see are stack-drift problems before they are platform problems.
What a 60-Page Audit Actually Looks At
A code audit is not a checklist, and the output is not a list of every imperfection in the codebase. It is a prioritized fix list – findings rated by severity (critical, high, medium, low) and mapped to business impact, so the engineering work that follows can be scoped against real-world tradeoffs.
For this engagement the audit covered four areas: security review, performance bottleneck analysis, stack hygiene, and frontend rendering. We measured response times across the main page templates, traced the LCP element on each, inventoried plugins against known CVEs, checked PHP version and deprecated function usage, and reviewed how the editorial team’s daily actions affected page weight at runtime.
The Audit Findings
Our audit produced a long list of items. The ones that mattered most fell into two clusters.
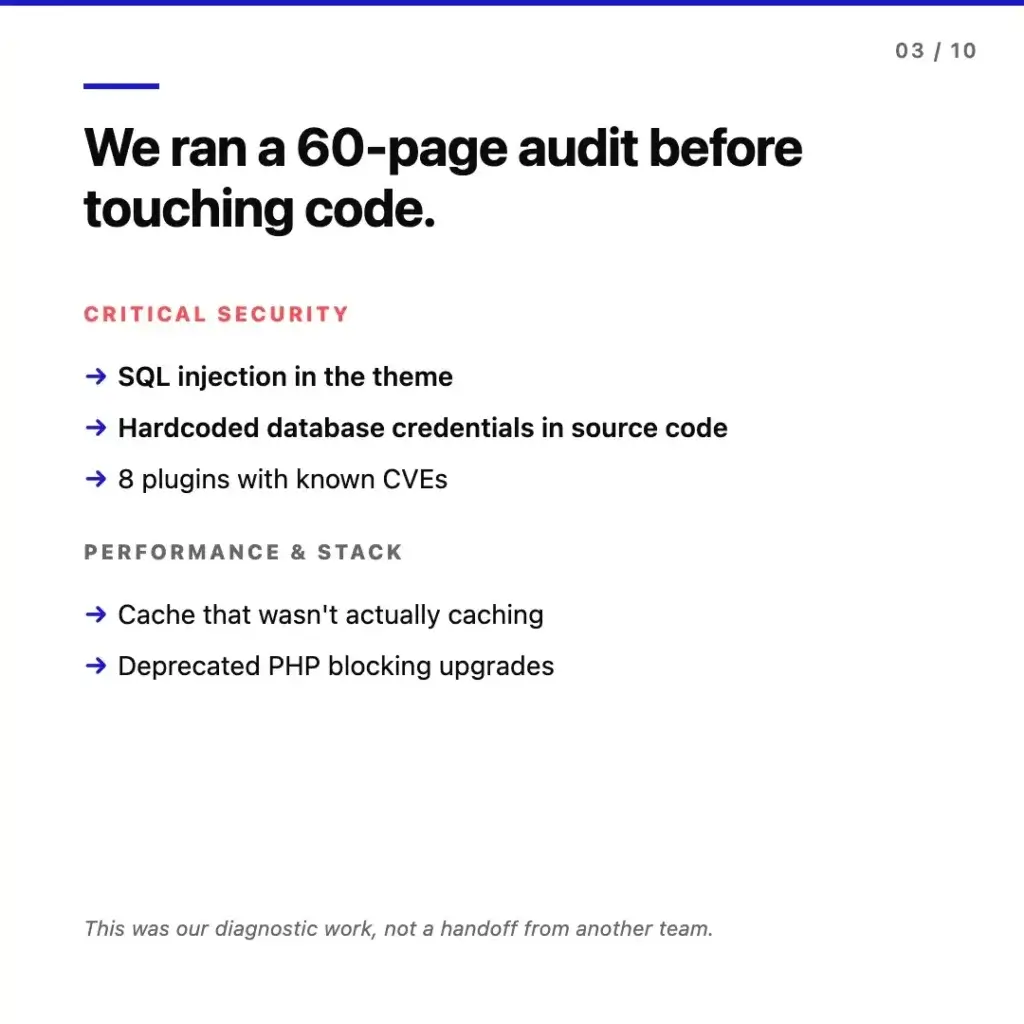
In critical security: a SQL injection vulnerability sitting in custom theme code, database credentials exposed in source code where they should not have been, and eight active plugins running with known CVEs that had patches available but never applied. None of those were discovered through penetration testing – they showed up in static analysis of the theme and active plugins, which is the kind of work that does not happen on a healthy maintenance schedule.
In performance and stack: a caching layer that the team thought was working but was actually missing on most requests, deprecated PHP blocking every other upgrade in the chain (plugin versions, hosting upgrades, security patches), and several theme functions running on every page load without need.
None of this is unusual on a long-lived WordPress site. The pattern we keep seeing in takeover audits is that none of it has been anyone’s specific job for years – hosting moves, devs rotate, plugins get installed for a campaign and forgotten, and the stack quietly drifts out of alignment. The audit is what surfaces the drift before it becomes the rewrite conversation. We have written about the same phenomenon from a different angle in WordPress Problems After Launch.
The Engineering Sprint: March 26 Onwards
With the audit finalized and the fix list prioritized, we scoped a first engineering sprint targeting the highest-impact findings – the ones most directly tied to mobile LCP, search position, and security exposure. Code work started March 26.
The first unlock was caching. Tuning the cache rules and fixing the configuration so the actual cache hit rate moved from 30% to 65% meant fewer requests reaching WordPress and the database on every page load. On a content site at this scale, that single change reshaped the response time distribution.
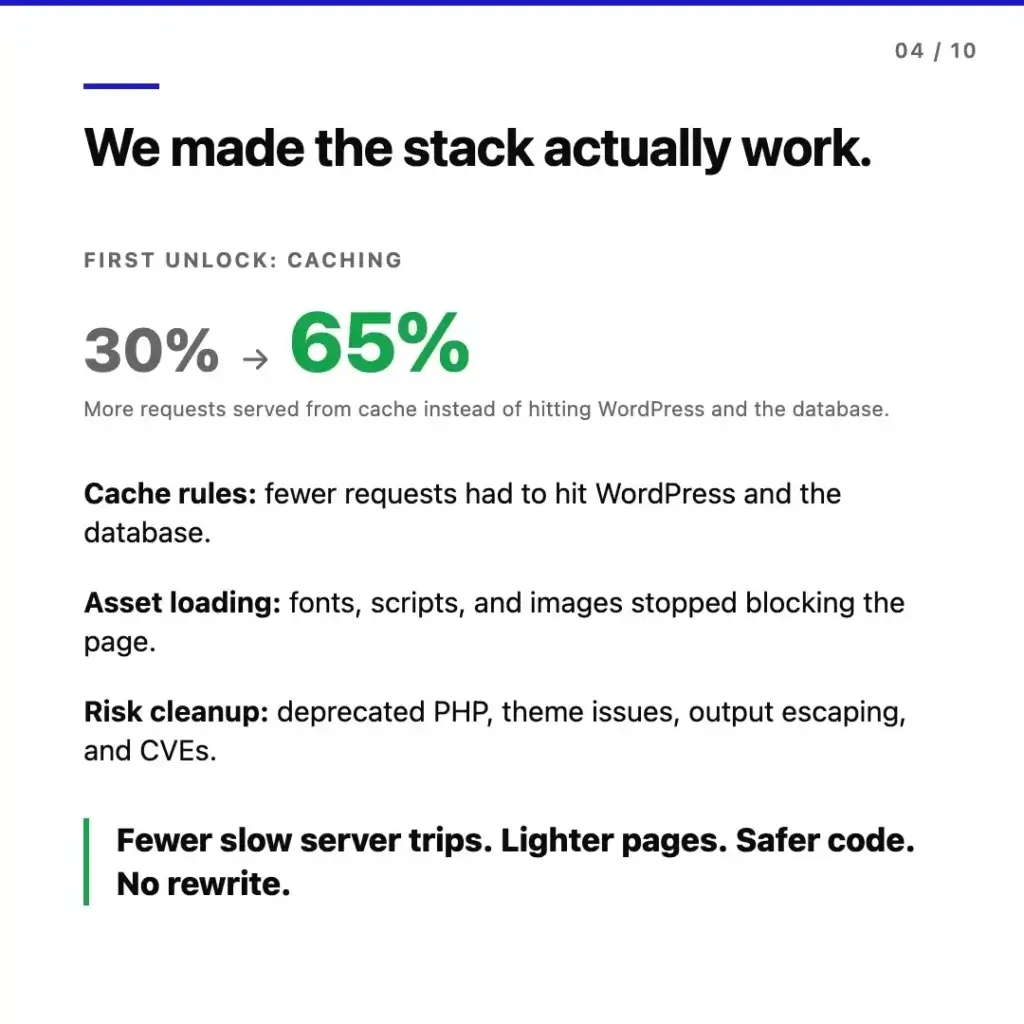
Asset loading was the second area. Fonts, scripts, and images had been blocking the render path through a combination of plugin defaults, theme decisions made years ago, and third-party scripts loaded synchronously. Reworking how assets were declared and prioritized meant pages could start rendering useful content earlier – the LCP element specifically.
Risk cleanup ran in parallel. Deprecated PHP usages were rewritten, theme issues were patched, output escaping was fixed across template files, and the CVE-affected plugins were either updated to safe versions or replaced with maintained alternatives. We did not swap any core functionality – the editorial workflow, plugin ecosystem, and content structure remained exactly as the team was using them.
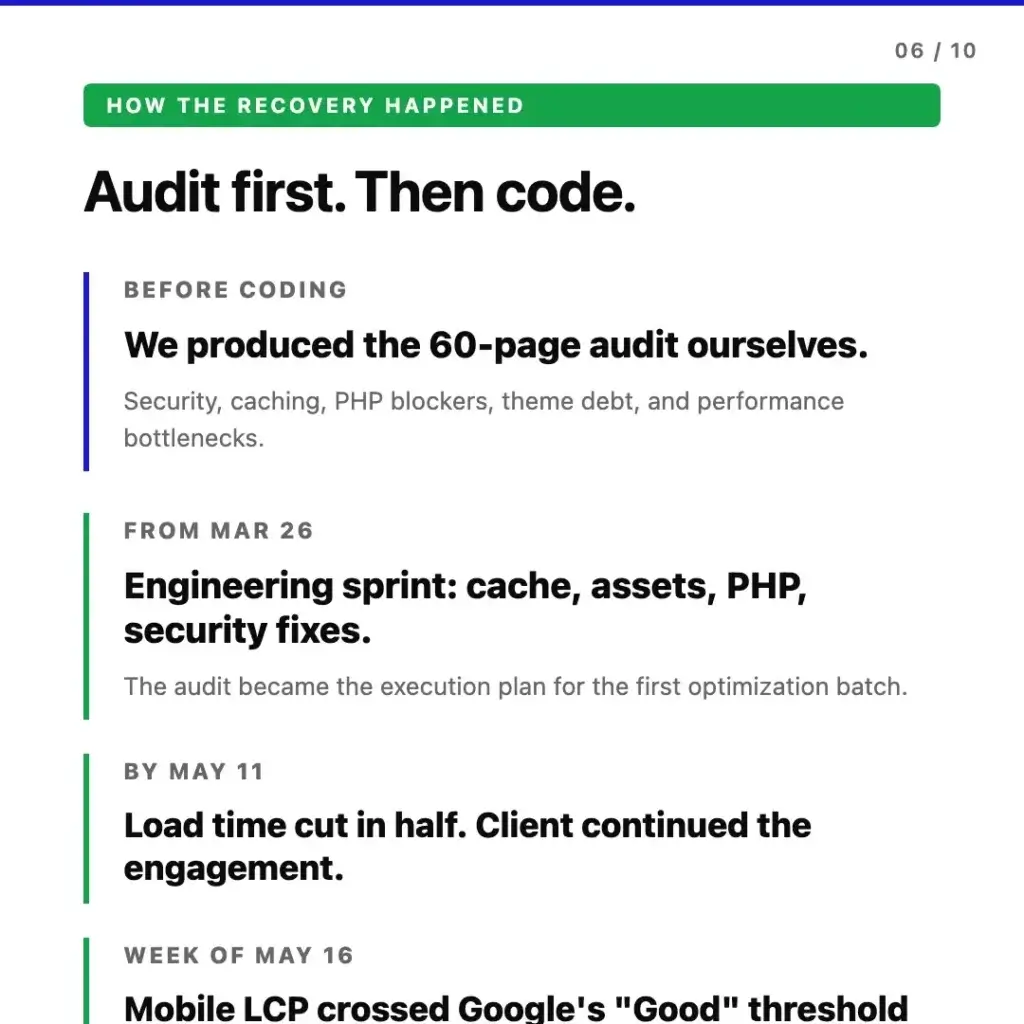
The work progressed against two checkpoints. By May 11 – roughly six weeks into the engineering sprint – mobile LCP on real users was down to 2.6 seconds. Load time cut in half. The site held position throughout, and the client extended into a second engagement phase. By the week of May 16, the trailing CrUX window pushed LCP down to 2.49 seconds – below Google’s 2.5-second “Good” threshold for the first time, with the site now sitting in the “Good” Core Web Vitals zone for real Chrome users.
The Receipts: Field Data, Not Lab Scores
Performance work without verifiable measurement is theater. Three independent data sources tracked across the audit-and-engineering window confirmed the recovery – and importantly, all three are field data on real users, not synthetic lab scores.
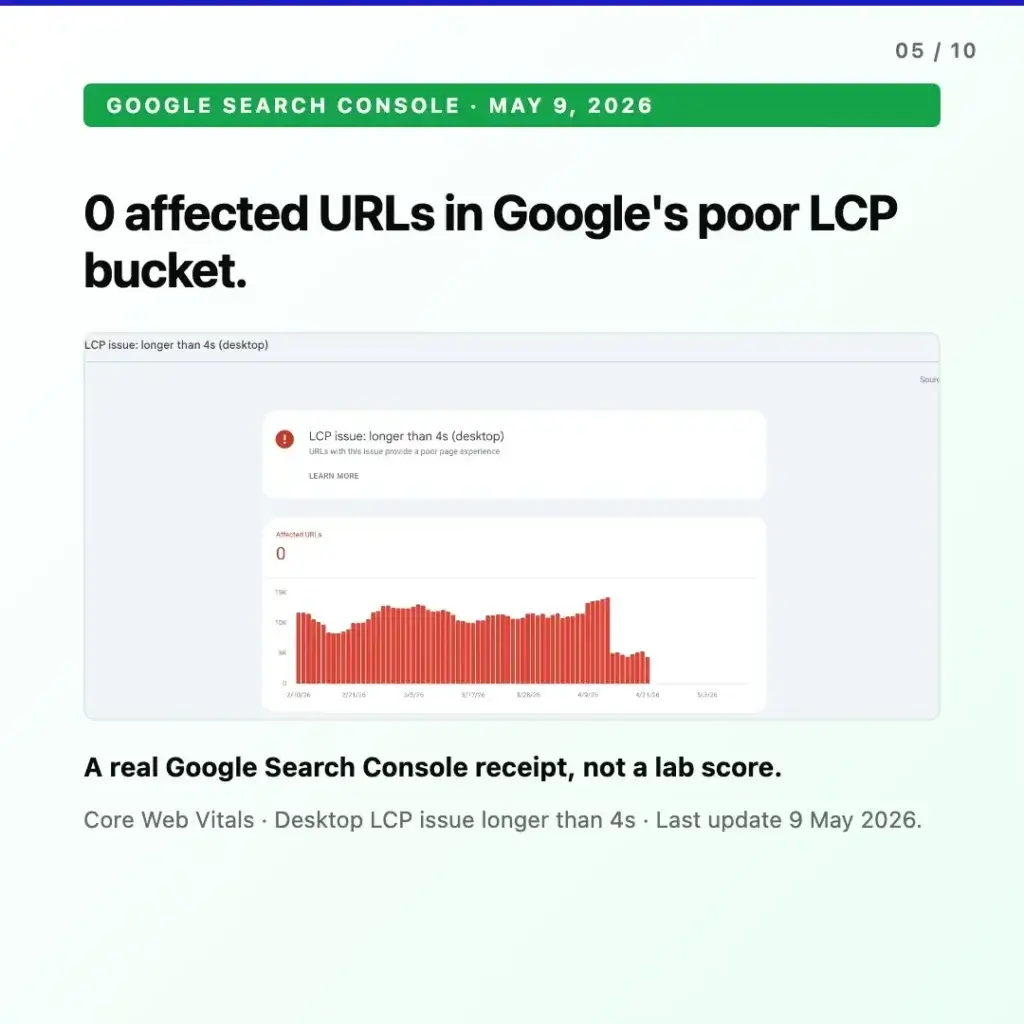
Google Search Console. As of May 9, 2026, the site held zero URLs in the desktop “LCP issue: longer than 4 seconds” bucket. At baseline, the same Search Console report had been showing the majority of measured URLs in that category. This is the field data Google itself uses for Page Experience signals – the same data that informs ranking, not a lab benchmark run from a Google data center.
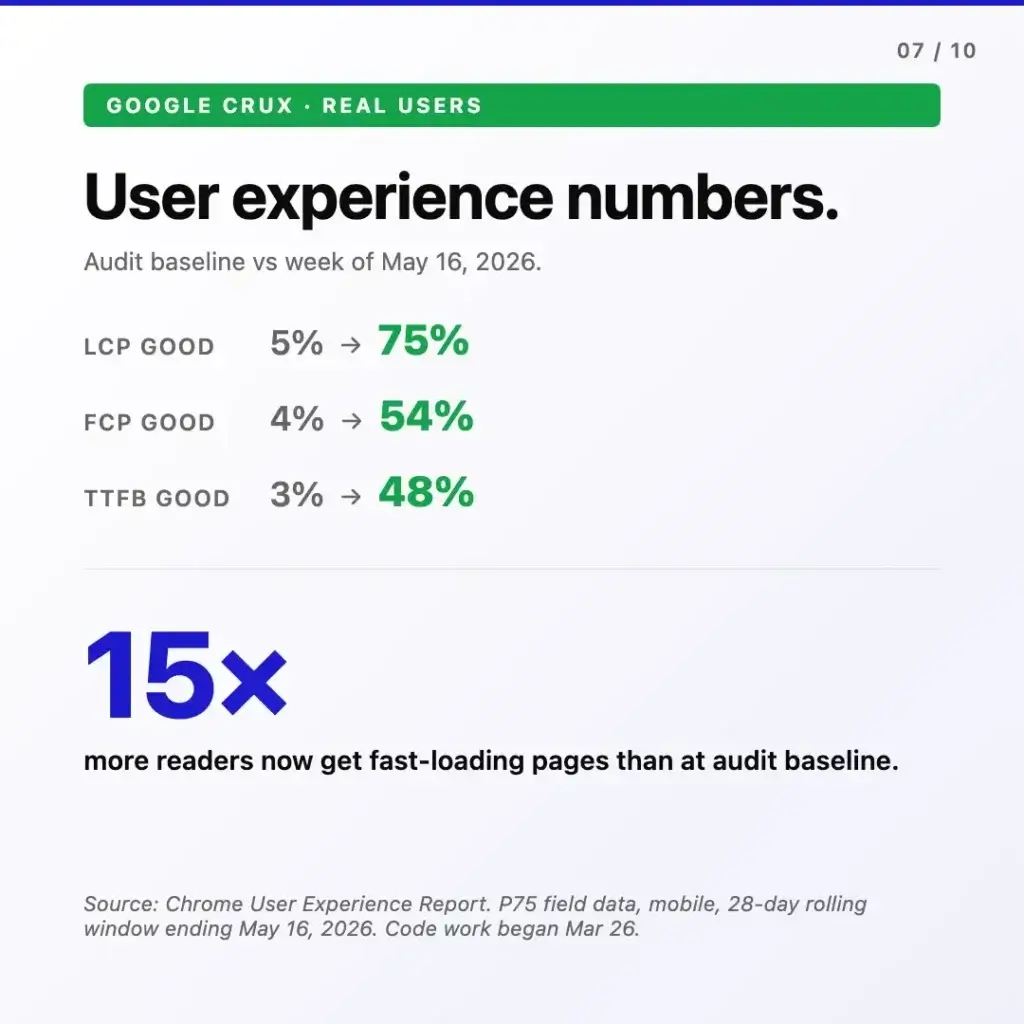
Chrome User Experience Report (CrUX). Pulling the trailing 28-day P75 mobile field data for the week ending May 16, 2026, the loading experience had moved in the same direction across every metric. LCP “good” share went from 5% to 75%. FCP “good” from 4% to 54%. TTFB “good” from 3% to 48%. In aggregate, 15 times more readers were landing on fast-loading pages compared to the audit baseline.
Google Analytics. Across the trailing 28-day window ending May 19, 2026 compared against the prior 28 days, every audience metric climbed in lockstep. Active users were up 44.0% (103K). Page views up 43.3% (154K). Events up 39.7% (495K). Across the same window, the platform’s search position held through the fix window with no ranking drop while substantial code shipped continuously into production.
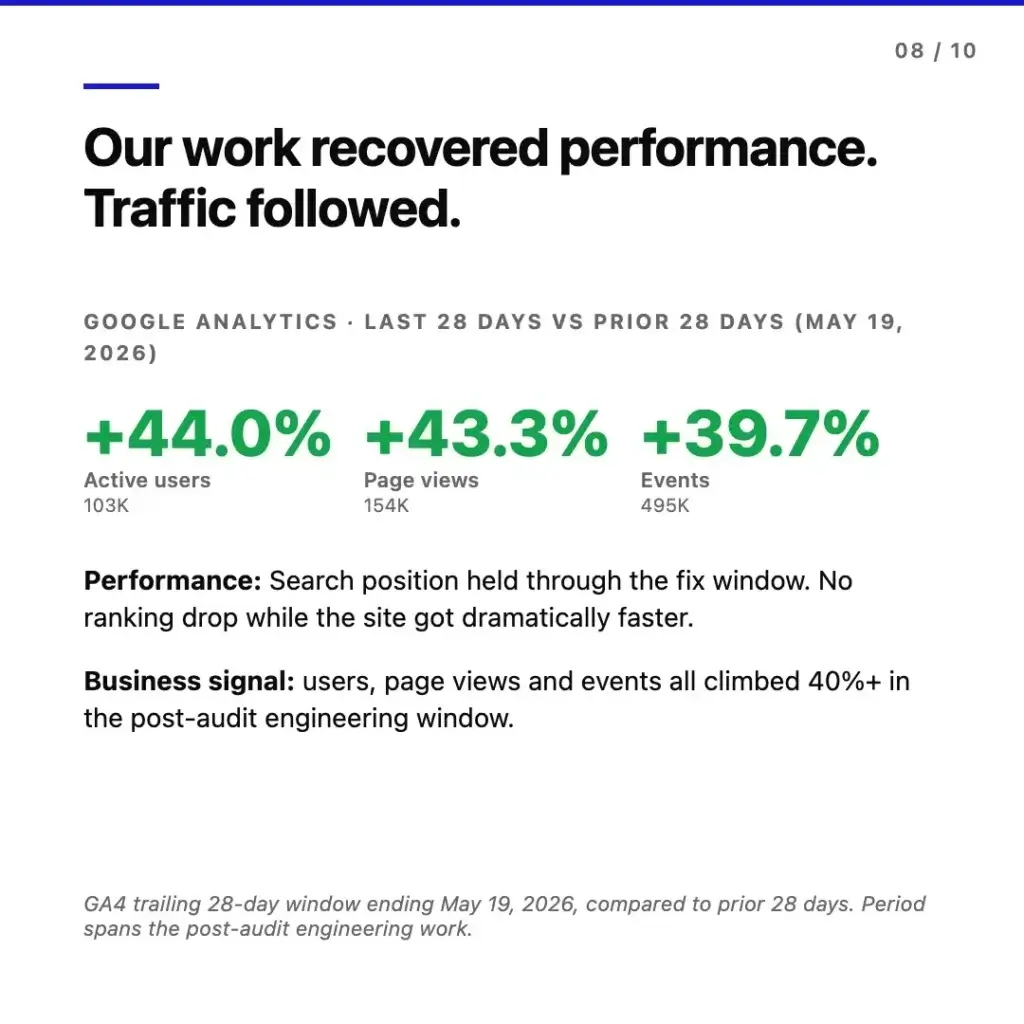
That last point deserves emphasis. The biggest worry on a content site of this age is that any non-trivial change triggers a temporary ranking dip that takes weeks to recover from. That did not happen here. The engineering work was deployed in measured batches, the URL structure was preserved exactly, no redirects were introduced, and positions held while the site got dramatically faster.
What Did Not Happen
It is worth listing what we did not do, because the absence is the point. The audit-first path meant no rewrite, no migration, no swap to another CMS or framework. No content was migrated, no URLs changed, no redirects were introduced. There was no SEO drop, no editorial workflow disruption, no downtime.
The rewrite path would have done all of those things, and taken months in the process – content to migrate, URLs to map, redirects to maintain, structured data to rebuild, an editorial team to retrain, and an organic traffic exposure window across the cutover. The audit-first path took eight weeks of focused engineering against a prioritized fix list and shipped continuously into production with the existing platform.
The Client Outcome
At the May 11 checkpoint, the client’s reaction was straightforward.
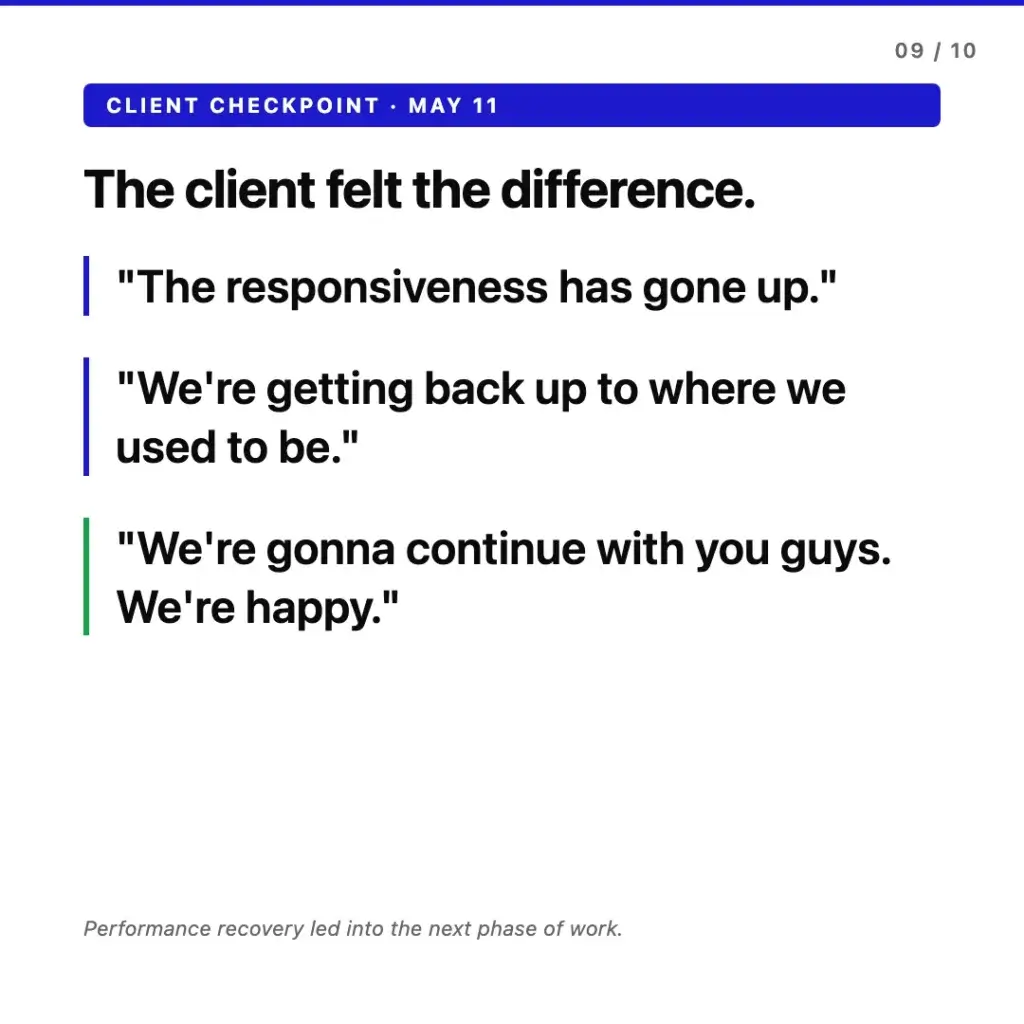
Performance recovery led directly into the next phase of work – a second engineering window focused on audit items that were not critical to LCP but had been queued for follow-up: ongoing security hygiene, plugin ecosystem cleanup, and a refresh of the technical maintenance setup for the platform going forward. By the time the week-of-May-16 CrUX window confirmed the site had crossed into Google’s “Good” zone, the engagement had already moved from recovery mode into continuous improvement.
What This Means for Your WordPress Site
If Google Search Console is flagging your site as slow, if Page Experience signals are yellow or red, or if your organic traffic is plateauing while your editorial team keeps publishing, the default options on the table tend to be: do nothing, try a few plugin tweaks, or scope a rewrite. There is a fourth option, and on long-lived WordPress sites it is almost always the right one. Audit first.
An audit does not presuppose the answer. A rewrite proposal does. The audit tells you which specific elements are slow, which fixes would have the biggest impact, and how much of the existing platform you can actually keep. For most sites we look at, the honest answer is: most of it. The rewrite conversation only makes sense after the audit closes off the cheaper, faster, safer paths – which is a different framing of the same point we made in our guide on when switching agencies needs an audit first.
Get an Audit
If your WordPress site is in this situation, we run the same audit-first diagnosis for every engagement. The output is a prioritized technical fix list scoped against your business goals, with engineering estimates against each item, so you can decide what to fix, in what order, and with what team.
A WordPress code audit typically takes 5-7 business days from when we get access, and answers the question every site owner is asking quietly while watching the GSC dashboard: do we need to rebuild, or can this be fixed.
FAQ
What is a WordPress code audit?
A WordPress code audit is a structured manual technical review of a live site, covering security, performance, stack hygiene, plugins, and frontend rendering. The output is a prioritized fix list with severity ratings – critical, high, medium, low – mapped to business impact, not a list of every imperfection in the codebase. Manual review surfaces issues automated scanners miss: logic flaws in custom code, performance bottlenecks tied to architecture, and technical debt that accumulated over years.
How long does WordPress performance recovery take?
In this case study the audit-and-engineering window ran around three months from start to “Good” Core Web Vitals threshold: roughly three weeks of audit and prioritization work, six weeks of focused engineering to the May 11 checkpoint where load time was already cut in half, and another two to three weeks for the field-data window to fully reflect the change. Most sites needing performance recovery sit in the 4-8 week range for the engineering phase, depending on scope and stack debt. The audit-first approach makes the engineering window predictable because the fix list is scoped before code work starts.
Do you need to rebuild a slow WordPress site?
For long-lived WordPress sites with significant SEO equity and active editorial workflows, the answer is usually no. Most “slow WordPress” cases are stack-drift problems – caching layers that stopped working after a hosting move, deprecated PHP, plugin debt, theme decisions made years ago – that are fixable through engineering, not rewriting. The audit is what tells you which path makes sense, based on evidence for your specific site.
What is “good” mobile LCP for WordPress?
Google’s threshold for “good” mobile LCP is 2.5 seconds or less, measured at the 75th percentile of real-user field data. Between 2.5 and 4 seconds is “needs improvement.” Above 4 seconds is “poor.” This is the field data Google uses for Page Experience signals and search ranking – different from the lab scores PageSpeed Insights shows by default at the top of the report.
What is the difference between PageSpeed Insights and CrUX field data?
PageSpeed Insights shows two numbers: a lab score (a simulated test run on demand from a Google data center) and a field score (real-user data from the Chrome User Experience Report, when available for the URL or origin). The lab score can pass while the field score fails – and Google ranks on field data, not lab. CrUX is the public dataset of real Chrome user measurements aggregated at origin and URL level. For Core Web Vitals work that actually affects rankings, field data is the only score that matters.